
The business problem
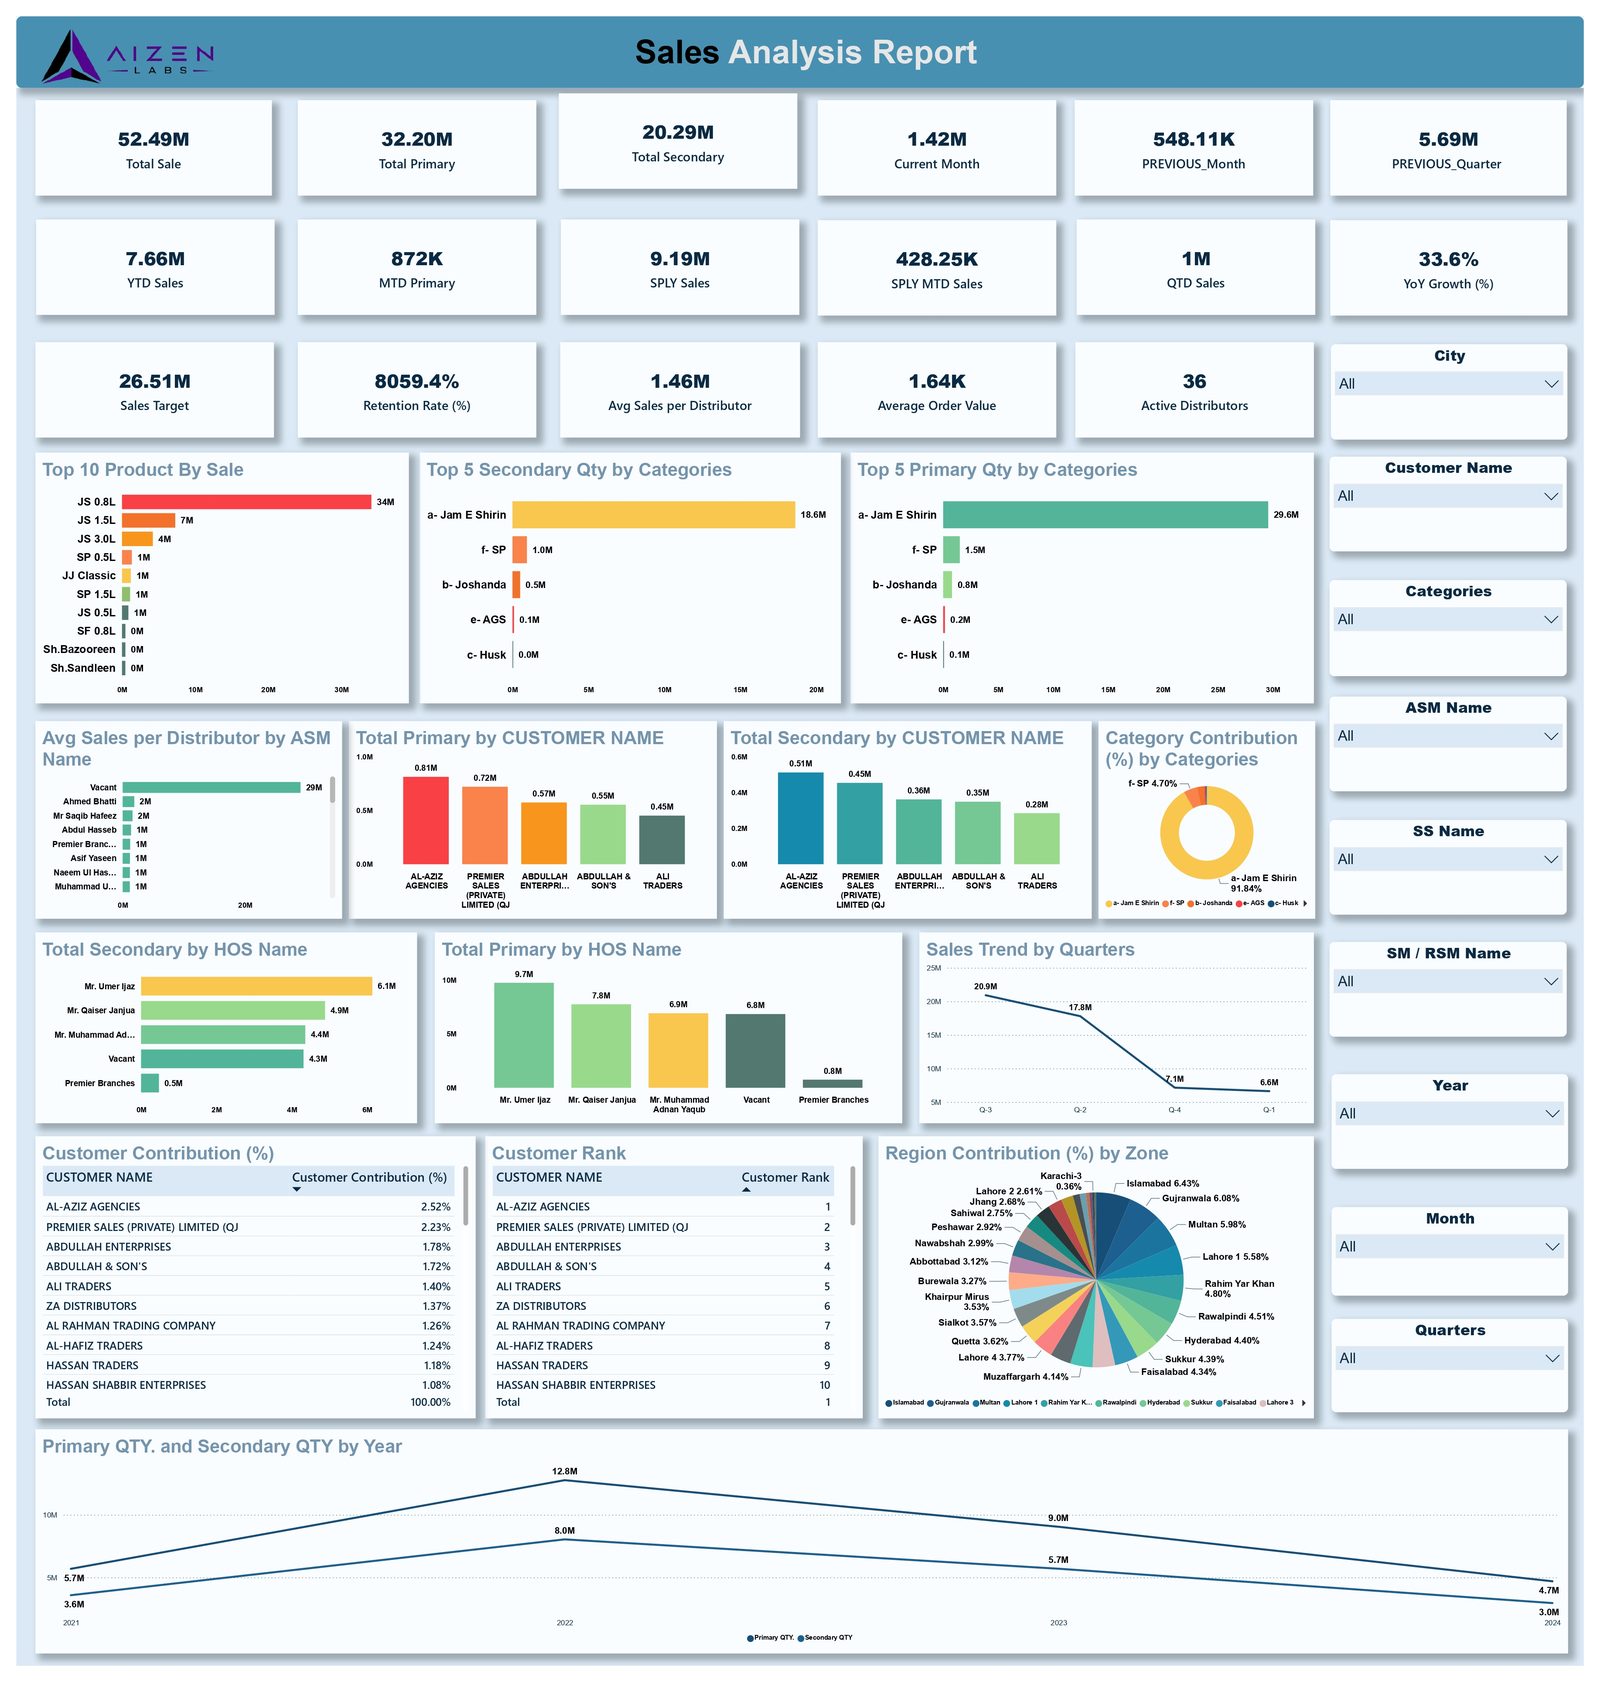
Distributor networks generate sales data across products, cities, and teams. This project turns it into structured reporting with targets, rankings, and regional breakdowns.
What it covers
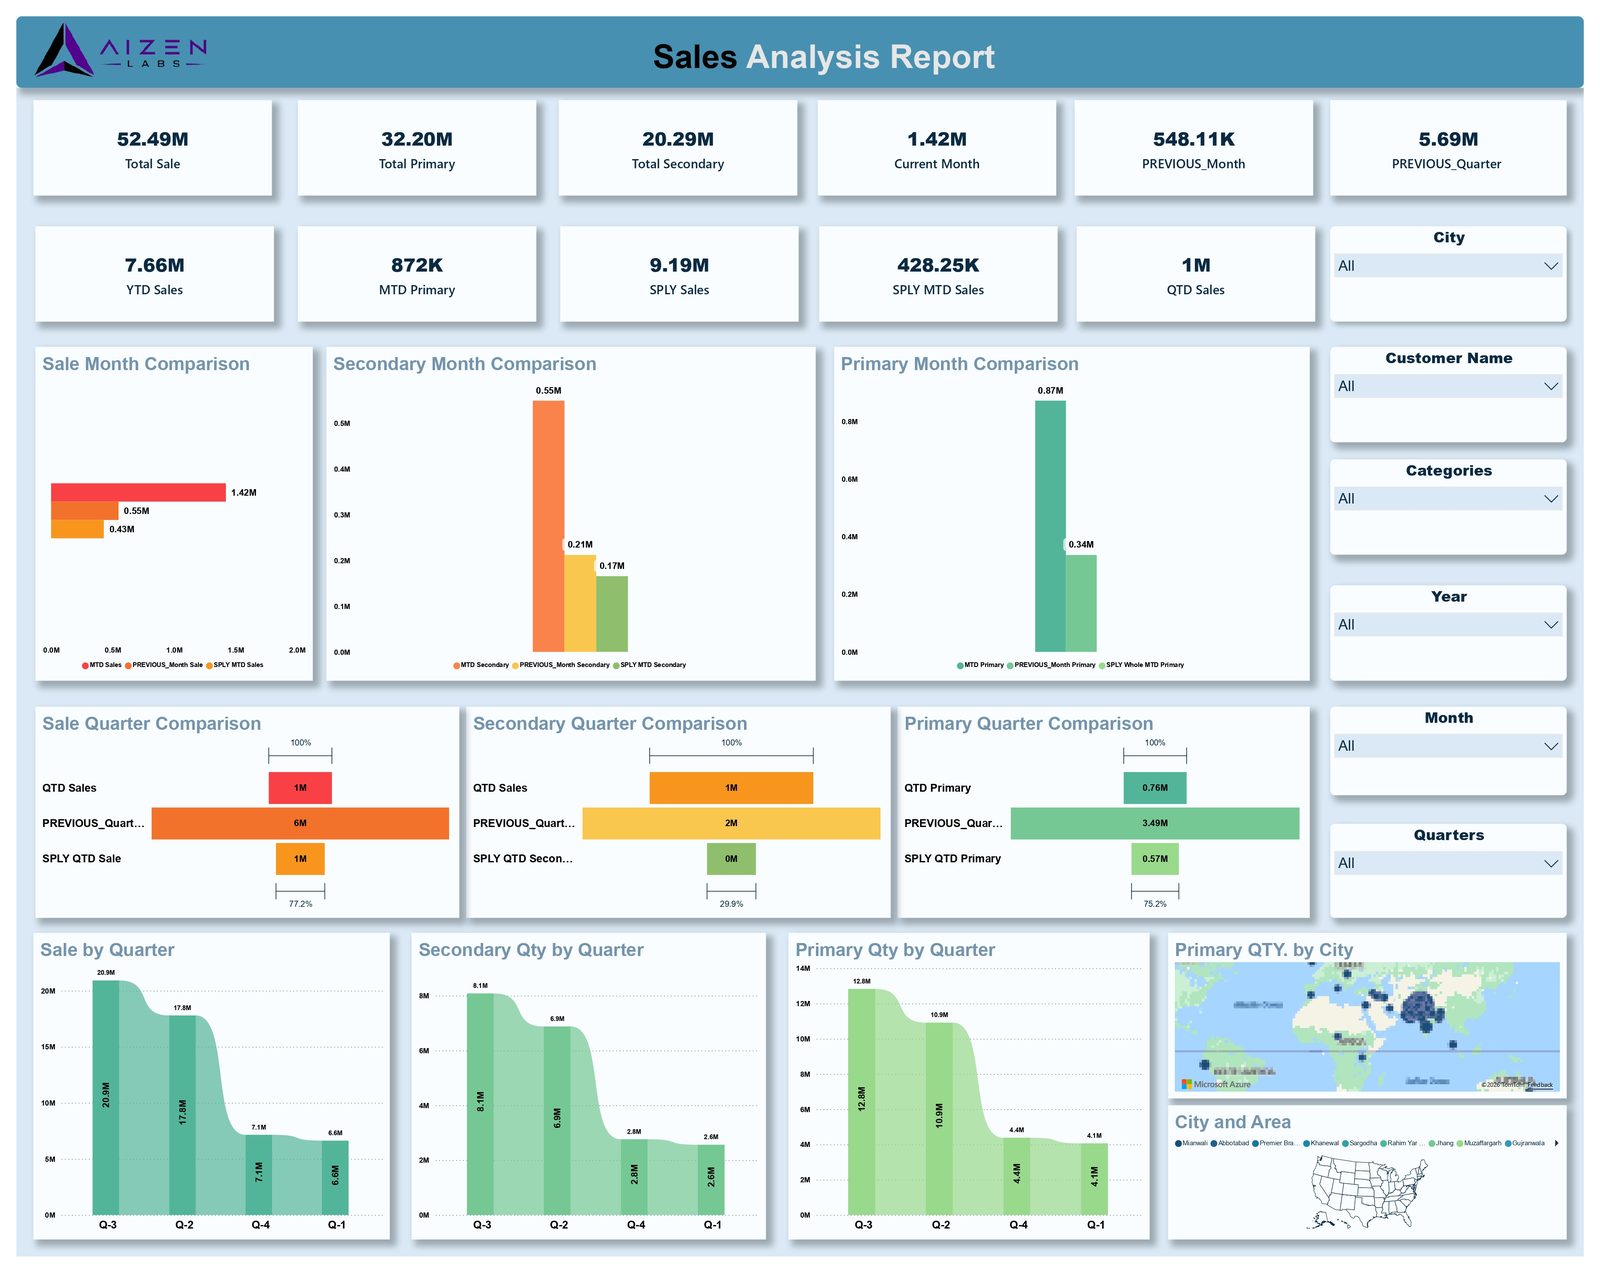
- Primary and secondary sales KPIs with year-over-year comparisons
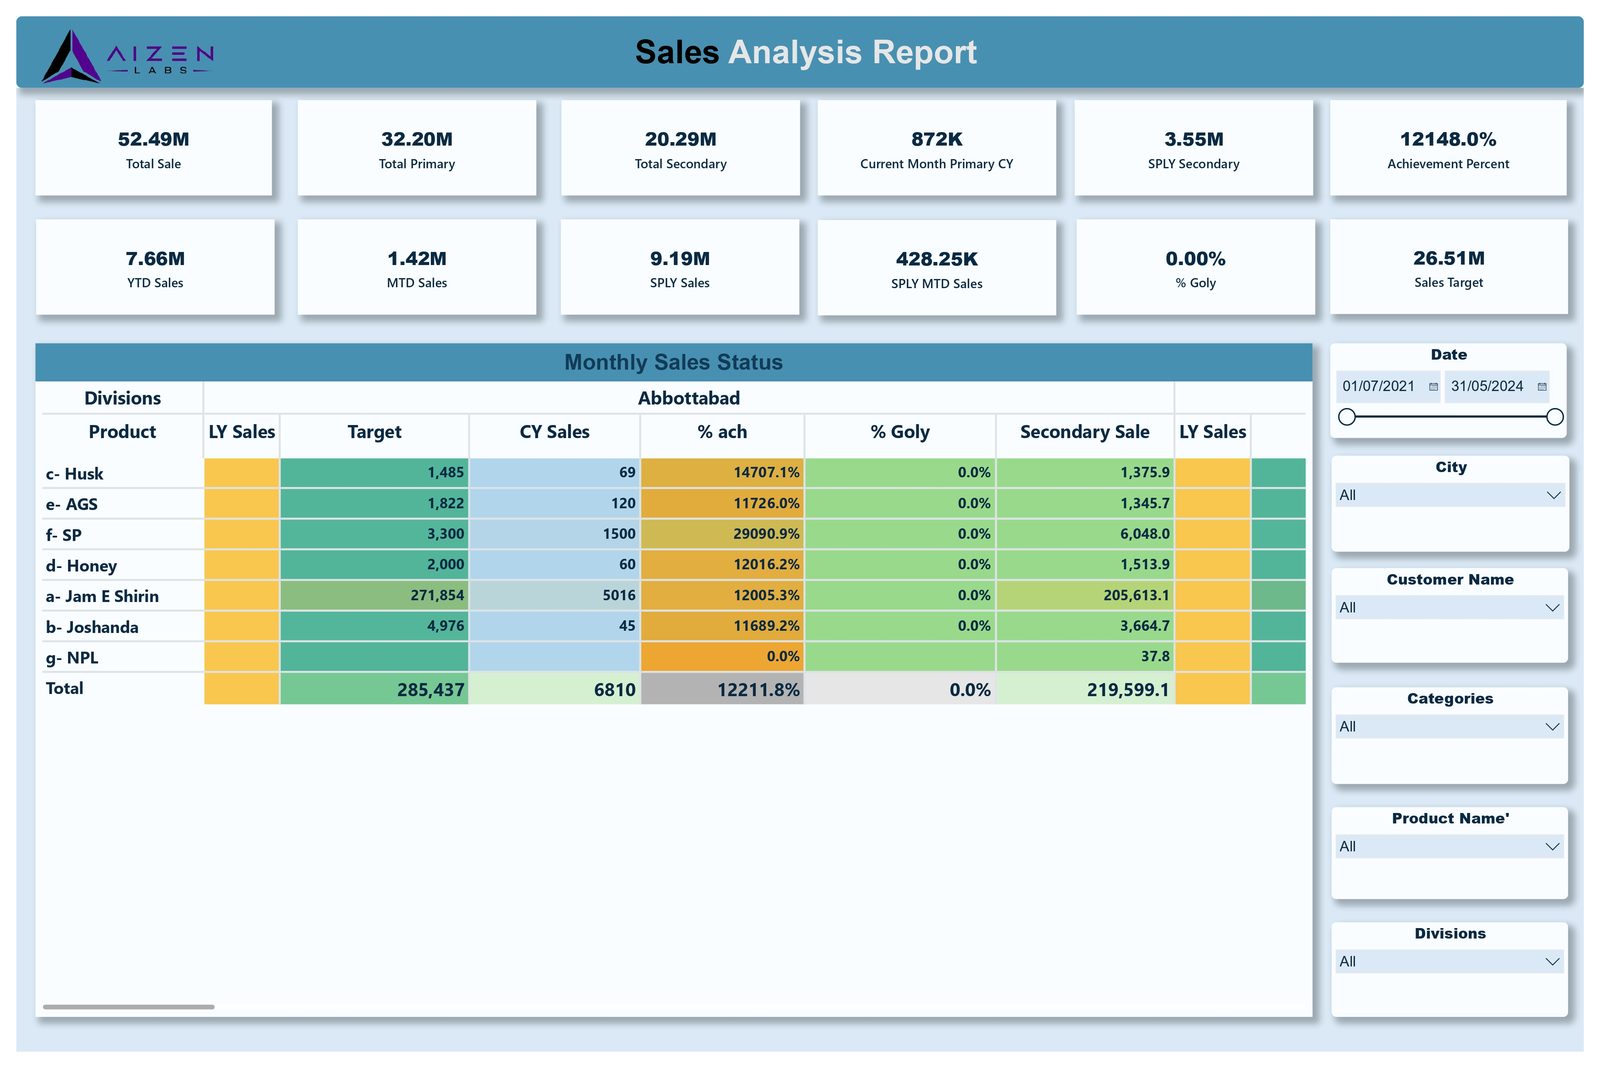
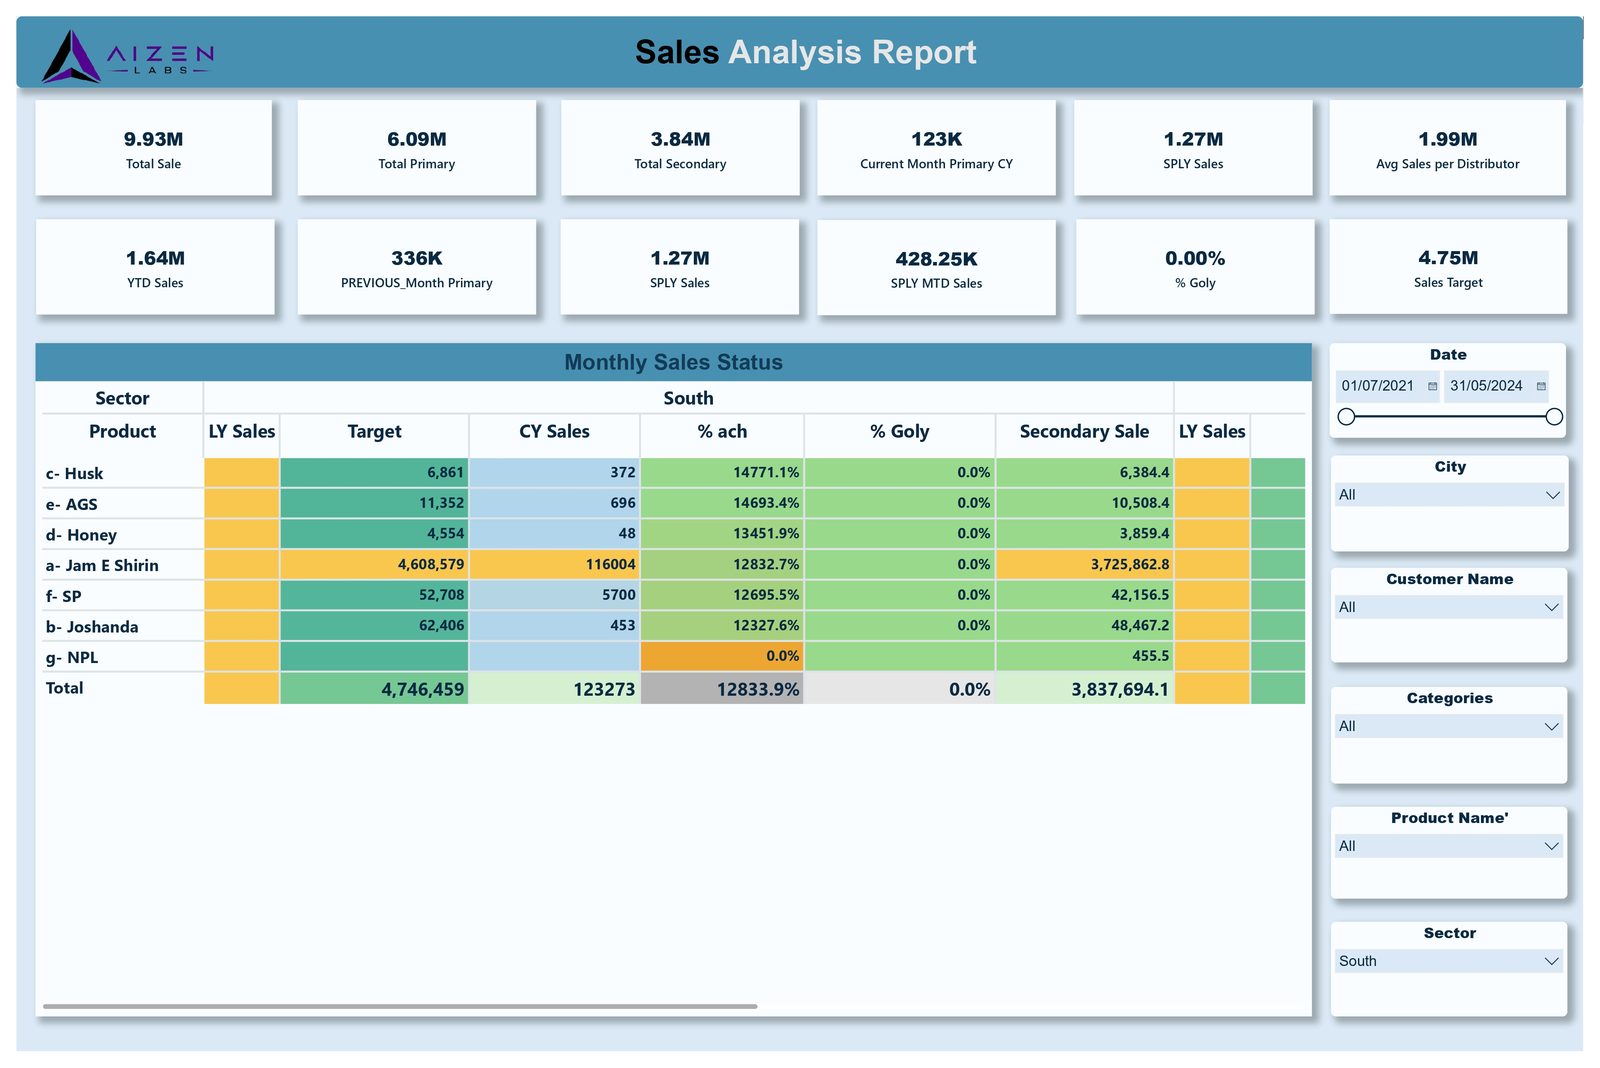
- Monthly sales status by product with targets and achievement rates
- Customer rankings and contribution analysis
- Regional and zone contribution with quarterly trends
What the business gets
- Primary and secondary sales tracked side by side
- Target achievement visible by product and period
- Customer and regional performance ranked
Technology
Power BI DAX Power Query
Start the conversation
Need reporting like this?
Tell us about your data and the decisions it should support.