
The business problem
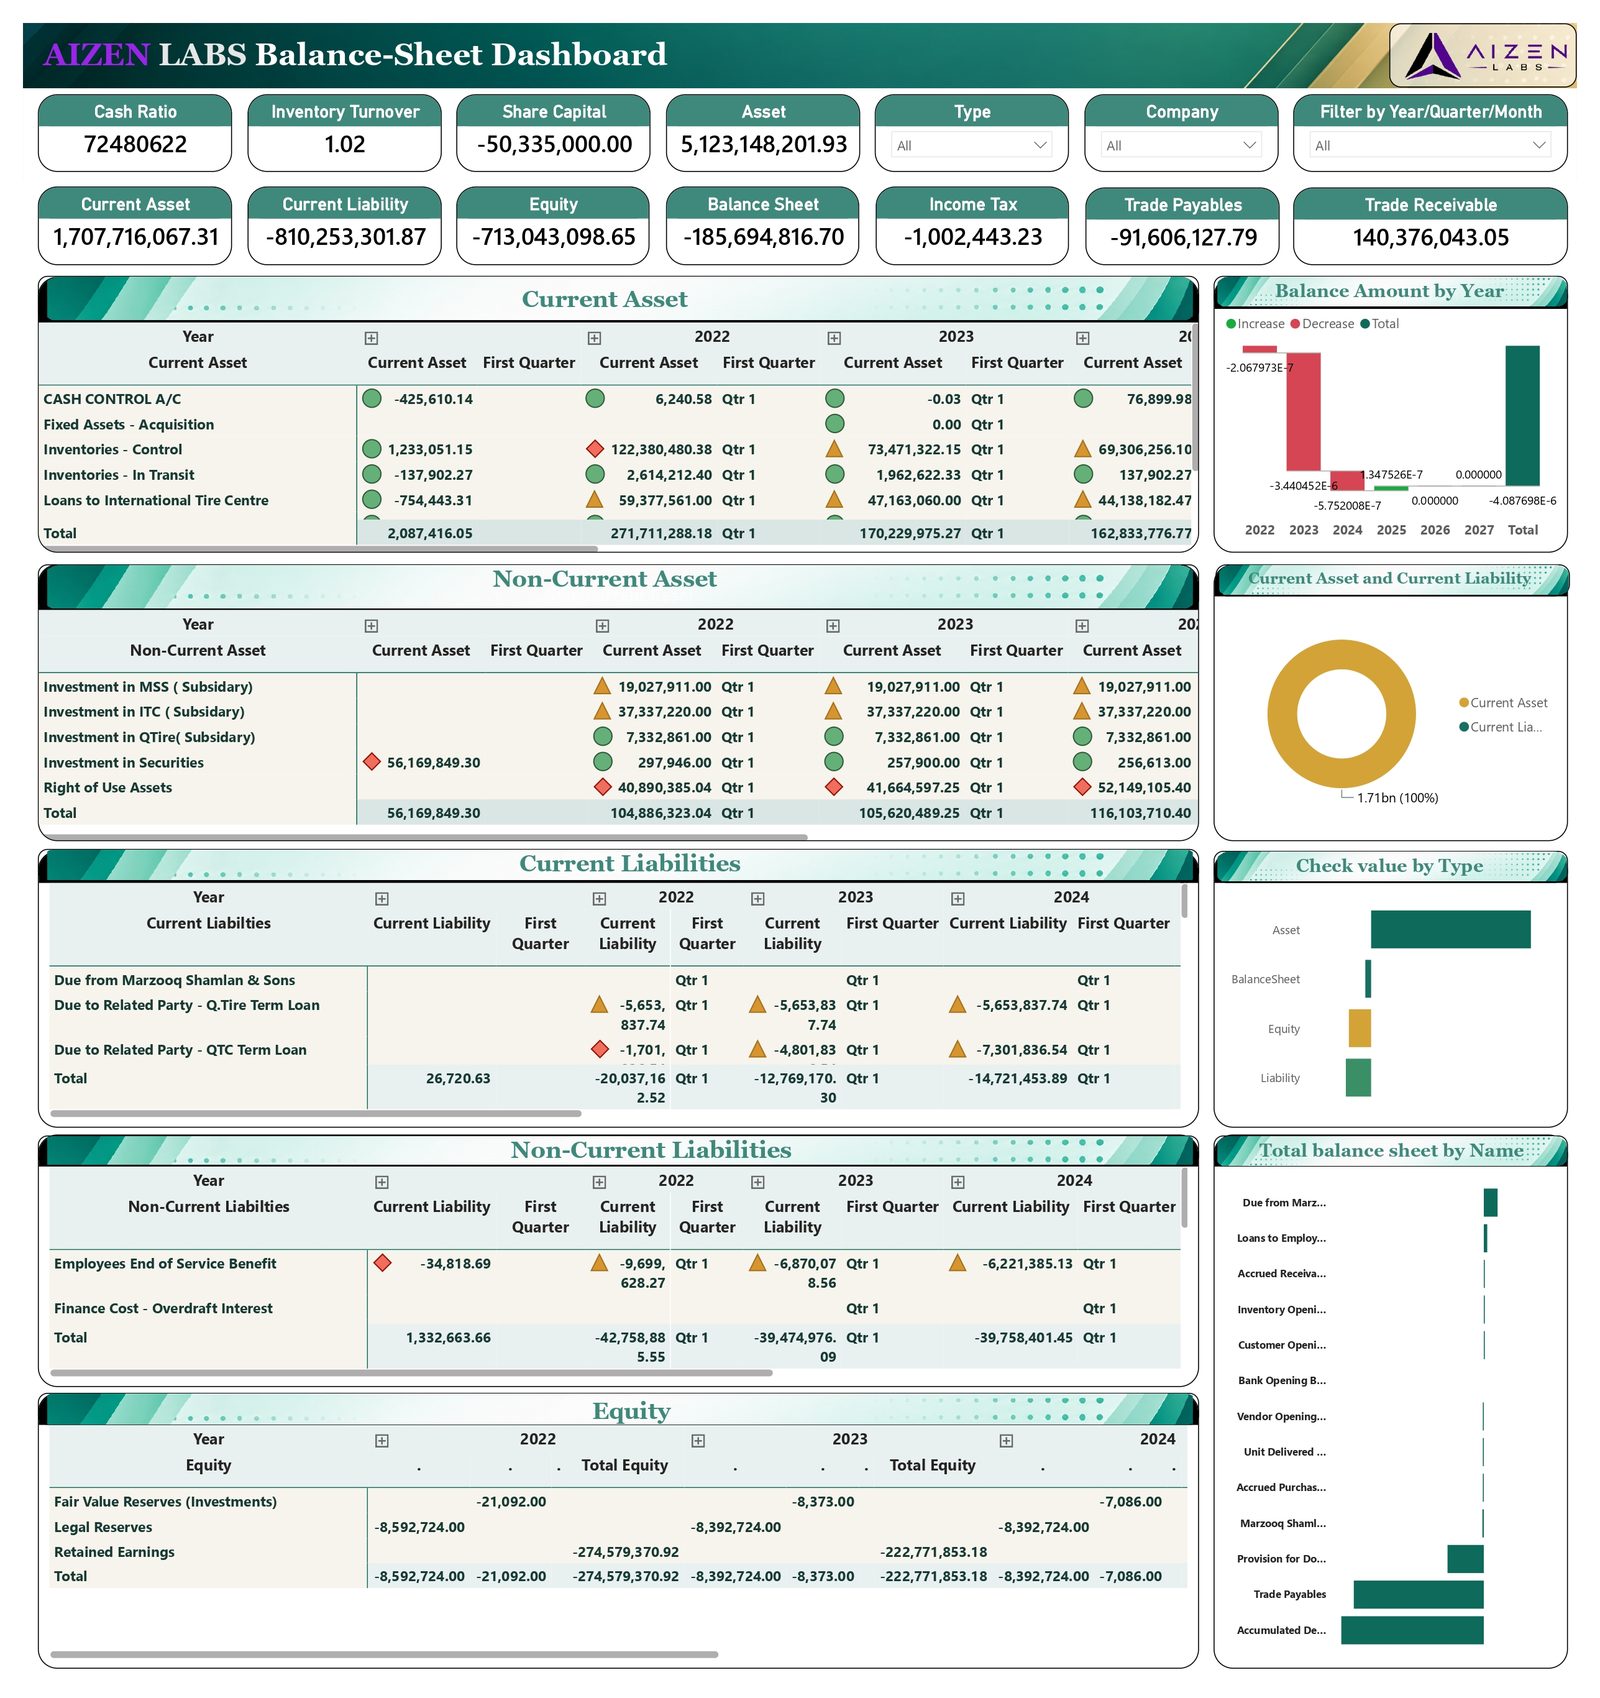
Balance-sheet data is dense. This dashboard structures it into current and non-current assets, liabilities, and equity, with year and quarter views.
What it covers
- Assets, liabilities, and equity broken down by year and quarter
- Cash ratio, inventory turnover, and other financial KPIs
- Balance amount trends by year
- Balance-sheet composition by account head
What the business gets
- The full balance sheet in a readable layout
- Ratio KPIs up front for a quick health check
- Year and quarter comparisons without spreadsheet wrangling
Technology
Power BI DAX Power Query
Start the conversation
Need reporting like this?
Tell us about your data and the decisions it should support.